Data Analytics
We assist you in understanding your business’s information by visualising it on a custom, easy to use, live, interactive dashboard.

Data Cleansing
Data cleaning entails filtering through your information thoroughly and separating what is important from what is not. Cleaning your data is imperative if you want a clutter free view of your business.

Data Analysis
Numbers are only numbers until you learn how to make sense of them; then they can open up worlds of knowledge. Data analysis is the practice of inspecting and modeling data with the goal of discovering useful information like correlations and trends in order to gain deeper insights that support decision making.

Data Visualization
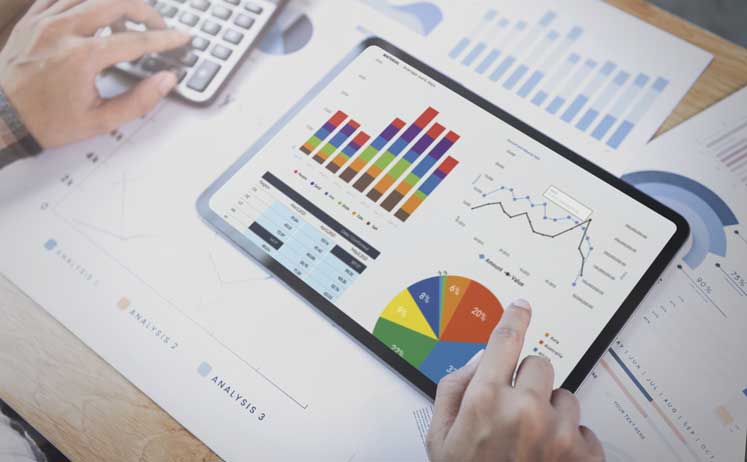
A picture speaks a thousand words and in the case of your data, it is no different. Visualising all of your data on one interactive and easy to use dashboard will enable you to gain greater insights into your information at the click of a button and in the blink of an eye.

Data Management
Organising data is a lot like organising items on a shelf in a grocery store. The Data needs to be structured, sorted and categorised for easy retrieval and usage.
Test Drive Our Dashboards Report
We can customise any of these to suit your specific individual needs
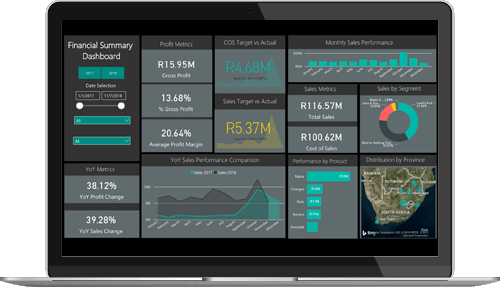
Financial Summary

Sales Overview

Cash Manager
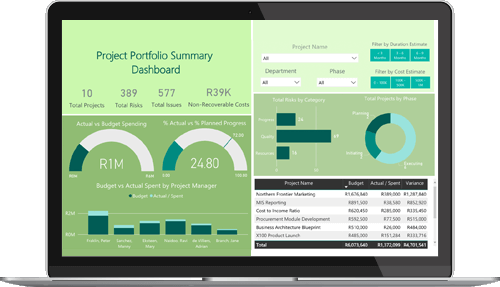
Project Portfolio Summary

Harvest Summary
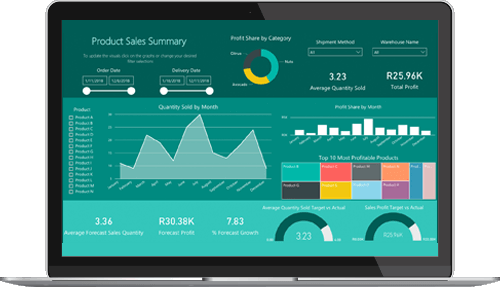
Product Sales Summary
Reach New Heights of Efficiency with Dashboard Reporting

Our services can support you in drawing conclusions and making well-informed decisions that align to your business strategy
- Real-time Data: Access all the info you require, anytime with live data
- Total Visibility into your business: You know what’s working and what’s not working.
- Increased Productivity: Dashboards allow you to measure performance, allowing your team to focus on metrics that require improvement
- Big time Savings: So how much time do you or your staff spend creating reports in Excel or other spreadsheet programs? Any report that you create reports in Excel or other spreadsheet programs? Any report that you create more than once should go in your dashboard